Basic Statistics
Element | 1961 | 1962 | 1963 | 1964 | 1965 | 1966 | 1967 | 1968 | 1969 | 1970 | 1971 | 1972 | 1973 | 1974 | 1975 | 1976 | 1977 | 1978 | 1979 | 1980 | 1981 | 1982 | 1983 | 1984 | 1985 | 1986 | 1987 | 1988 | 1989 | 1990 | 1991 | 1992 | 1993 | 1994 | 1995 | 1996 | 1997 | 1998 | 1999 | 2000 | 2001 | 2002 | 2003 | 2004 | 2005 | 2006 | 2007 | 2008 | 2009 | 2010 | 2011 | 2012 | 2013 | 2014 |
|---|---|---|---|---|---|---|---|---|---|---|---|---|---|---|---|---|---|---|---|---|---|---|---|---|---|---|---|---|---|---|---|---|---|---|---|---|---|---|---|---|---|---|---|---|---|---|---|---|---|---|---|---|---|---|
Arable land (000 Ha) | 3,520.00 | 3,519.00 | 3,495.00 | 3,471.00 | 3,448.00 | 3,424.00 | 3,400.00 | 3,376.00 | 3,352.00 | 3,329.00 | 3,305.00 | 3,281.00 | 3,257.00 | 3,234.00 | 3,210.00 | 3,186.00 | 3,162.00 | 3,138.00 | 3,115.00 | 3,091.00 | 3,067.00 | 3,043.00 | 3,019.00 | 2,996.00 | 2,972.00 | 2,948.00 | 2,924.00 | 2,901.00 | 2,877.00 | 2,853.00 | 2,829.00 | 2,805.00 | 2,782.00 | 2,758.00 | 2,734.00 | 2,617.00 | 2,500.00 | 2,385.00 | 2,200.00 | 2,149.00 | 2,200.00 | 2,390.00 | 2,475.00 | 2,550.00 | 2,741.00 | 2,750.00 | 2,800.00 | 2,850.00 | 2,850.00 | 2,900.00 | 2,900.00 | 3,000.00 | 3,100.00 | |
Rice area (000 Ha) | 123.98 | 129.44 | 135.15 | 141.10 | 147.31 | 153.79 | 160.57 | 167.64 | 175.02 | 182.73 | 190.78 | 199.17 | 207.94 | 217.10 | 226.66 | 236.64 | 247.06 | 257.94 | 269.30 | 281.15 | 293.54 | 306.46 | 319.96 | 334.04 | 348.76 | 364.11 | 380.14 | 396.88 | 414.36 | 432.60 | 451.66 | 471.54 | 492.31 | 513.98 | 536.62 | 560.25 | 584.92 | 610.67 | 637.57 | 665.64 | 601.09 | 629.70 | 659.68 | 691.08 | 723.97 | 758.43 | 788.77 | 794.54 | 765.00 | 809.00 | 880.00 | 1,000.00 | 1,100.00 | 985.00 |
Paddy yield (t/Ha) | 1.70 | 1.70 | 1.70 | 1.70 | 1.70 | 1.70 | 1.70 | 1.70 | 1.70 | 1.70 | 1.70 | 1.70 | 1.71 | 1.71 | 1.71 | 1.71 | 1.71 | 1.71 | 1.71 | 1.71 | 1.71 | 1.71 | 1.71 | 1.71 | 1.71 | 1.71 | 1.71 | 1.71 | 1.71 | 1.71 | 1.71 | 1.71 | 1.71 | 1.71 | 1.71 | 1.71 | 1.71 | 1.71 | 1.71 | 1.71 | 1.72 | 1.73 | 1.74 | 1.75 | 1.76 | 1.77 | 1.78 | 1.93 | 1.90 | 1.85 | 1.90 | 1.92 | 1.87 | 2.00 |
Paddy Production (000 t) | 210.94 | 220.27 | 230.02 | 240.19 | 250.81 | 261.90 | 273.49 | 285.58 | 298.21 | 311.40 | 325.18 | 339.56 | 354.58 | 370.26 | 386.64 | 403.74 | 421.60 | 440.25 | 459.72 | 480.06 | 501.29 | 523.46 | 546.61 | 570.79 | 596.04 | 622.40 | 649.92 | 678.67 | 708.69 | 740.04 | 772.76 | 806.94 | 842.64 | 879.90 | 918.82 | 959.46 | 1,001.90 | 1,046.21 | 1,092.49 | 1,140.81 | 1,033.52 | 1,088.67 | 1,146.76 | 1,207.96 | 1,272.42 | 1,340.31 | 1,401.59 | 1,534.09 | 1,455.93 | 1,498.96 | 1,670.00 | 1,919.00 | 2,053.00 | 1,971.00 |
Milled production (000 t) | 140.70 | 146.92 | 153.42 | 160.21 | 167.29 | 174.69 | 182.42 | 190.48 | 198.91 | 207.71 | 216.90 | 226.49 | 236.50 | 246.97 | 257.89 | 269.30 | 281.21 | 293.65 | 306.63 | 320.20 | 334.36 | 349.15 | 364.59 | 380.72 | 397.56 | 415.14 | 433.50 | 452.67 | 472.70 | 493.60 | 515.43 | 538.23 | 562.04 | 586.90 | 612.86 | 639.96 | 668.27 | 697.82 | 728.69 | 760.92 | 689.36 | 726.14 | 764.89 | 805.71 | 848.70 | 893.99 | 934.86 | 1,023.24 | 971.11 | 999.81 | 1,113.89 | |||
Rice imports (000 t) | 21.00 | 25.00 | 41.60 | 40.00 | 37.00 | 40.00 | 18.65 | 25.00 | 10.00 | 30.00 | 15.00 | 17.00 | 30.00 | 30.00 | 36.20 | 20.00 | 35.50 | 50.00 | 71.20 | 128.00 | 77.60 | 46.54 | 77.02 | 80.00 | 70.00 | 80.00 | 90.00 | 193.47 | 195.44 | 182.16 | 182.16 | 246.49 | 213.63 | 278.68 | 290.78 | 212.76 | 196.29 | 159.83 | 209.74 | 172.36 | 251.44 | 331.98 | 307.33 | 97.87 | 160.83 | 251.81 | 332.65 | 339.37 | 237.31 | 238.01 | 148.09 | 369.11 | 363.76 | |
Rice exports (000 t) | 1.46 | 13.06 | 0.01 | 0.42 | 0.10 | 0.01 | 0.01 | 1.10 | 0.02 | 0.04 | 0.04 | 0.04 | 0.04 | 0.04 | 0.04 | |||||||||||||||||||||||||||||||||||||||
Total rice consumption (000 t) | 161.70 | 138.57 | 195.02 | 200.21 | 237.64 | 214.69 | 201.07 | 215.48 | 208.91 | 232.71 | 233.90 | 246.49 | 259.83 | 276.97 | 294.09 | 289.30 | 316.71 | 343.65 | 377.84 | 376.52 | 421.96 | 422.35 | 444.94 | 437.38 | 464.22 | 508.48 | 550.18 | 666.15 | 668.14 | 675.76 | 697.59 | 764.72 | 795.67 | 865.58 | 894.37 | 872.66 | 857.10 | 864.00 | 906.80 | 945.97 | 971.38 | 989.96 | 970.29 | 978.46 | 1,023.09 | 1,131.16 | 1,167.80 | 1,280.48 | 1,291.01 | 1,301.68 | 1,353.43 | |||
Fertilizer usage (NPK) (000 t) | 0.48 | 0.48 | 0.54 | 0.89 | 0.87 | 1.02 | 1.03 | 0.74 | 0.75 | 0.90 | 0.88 | 0.85 | 0.31 | 0.57 | 0.47 | 0.41 | 0.25 | 0.32 | 0.71 | 0.09 | 0.27 | 0.28 | 0.00 | 0.07 | 0.12 | 0.22 | 0.31 | 0.22 | 0.29 | 0.41 | 0.69 | 0.18 | 0.57 | 1.45 | 1.87 | 1.62 | 0.72 | 1.38 | 1.45 | 1.49 | 1.45 | 1.00 | 0.79 | 1.03 | 0.92 | 0.88 | 1.21 | 1.30 | 0.64 | 1.05 | 1.07 | 2.30 | 1.61 |
Production |
Imports and exports |
Caloric intake (%/day) from rice relative to other sources |
Protein intake (%/day) from rice relative to other sources |
General information
|
Production seasons
|
Write-up taken from the IRRI's Rice Almanac (2013):
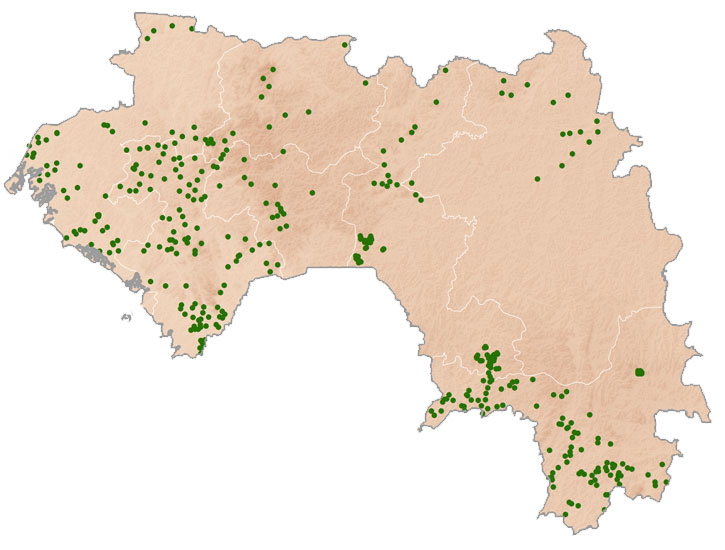
Guinea is a populous country (population 10.2 million in 2011) of West Africa, facing the Atlantic Ocean between Guinea Bissau and Sierra Leone. The majority of the population lives on a hot, humid coastal plain, where rice and other crops are grown. There is a central mountainous region and a drier northeastern area where maize and similar crops are cultivated. Arable land is 11.6% of the land area of 245,720 km2. Some 80% of the workforce is agricultural, yet agriculture made up only 22.1% of GDP in 2011.
Source: FAOSTAT database online and AQUASTAT database online, as of November 2012.